 Michele Eccher
On this page
Which SEO KPIs should you request, and where do you find them?
KPIs are the measures you use to judge progress toward a goal. If your goal is to generate quote requests, your report needs to follow those requests through to qualified leads and sales. Search and website data help explain why those outcomes change. Ask for access to the original reports or exports with clearly stated dates and filters.
| Source | What to review | Question it answers |
|---|---|---|
| Search Console | Impressions, clicks, CTR and position by query and page. | Which Google searches show your site and bring it clicks? |
| Google Analytics 4 | Sessions, landing pages and key events, filtered by source. | What happens during the visits recorded on your site? |
| CRM or sales log | Unique inquiries, qualified leads, opportunities, customers and revenue. | Which inquiries are a good fit for the business, and how do they turn out? |
| Accounting and project costs | Net revenue, variable costs of sales and SEO spending. | How much contribution margin remains after the cost of the work? |
A Search Console click happens on a Google result; a GA4 session groups interactions on your site. Tags, consent settings and counting rules can produce different totals. Google's guidance on comparing Search Console and Analytics explains those differences. Look for consistent trends and investigate new or large discrepancies. The totals do not have to match.
Keep estimates from SEO tools separate, too. The Beton Asfalti case study distinguishes traffic estimated by SEOZoom from clicks recorded in Search Console. Those charts provide evidence of visibility and traffic. Sales or ROI calculations would also need the corresponding sales records.
Check dates and tracking before comparing results
For your first report, you can compare the last 28 complete days with the previous 28. Both periods have the same length and mix of weekdays. That makes them convenient to compare; it does not make 28 days a threshold for reliable results. If demand is seasonal, also compare the same period a year earlier and note holidays, promotions or changes to your offer.
At the top of the report, record the Search Console property, dates, country, devices and search type. In GA4, record the same dates, the property's time zone and your channel filter. To compare Google traffic, use google / organic. The Organic Search channel group includes other search engines. Exclude days that are still incomplete in each tool.
A tracking change can look like a performance change
Keep a log of changes to the consent banner, tags, forms and key event definitions. Suppose that on the 15th you switch from counting button clicks to counting successful form submissions. The series measures something different from that date onward. Separate the periods and check actual submissions in your business system before treating the difference as a drop in inquiries.
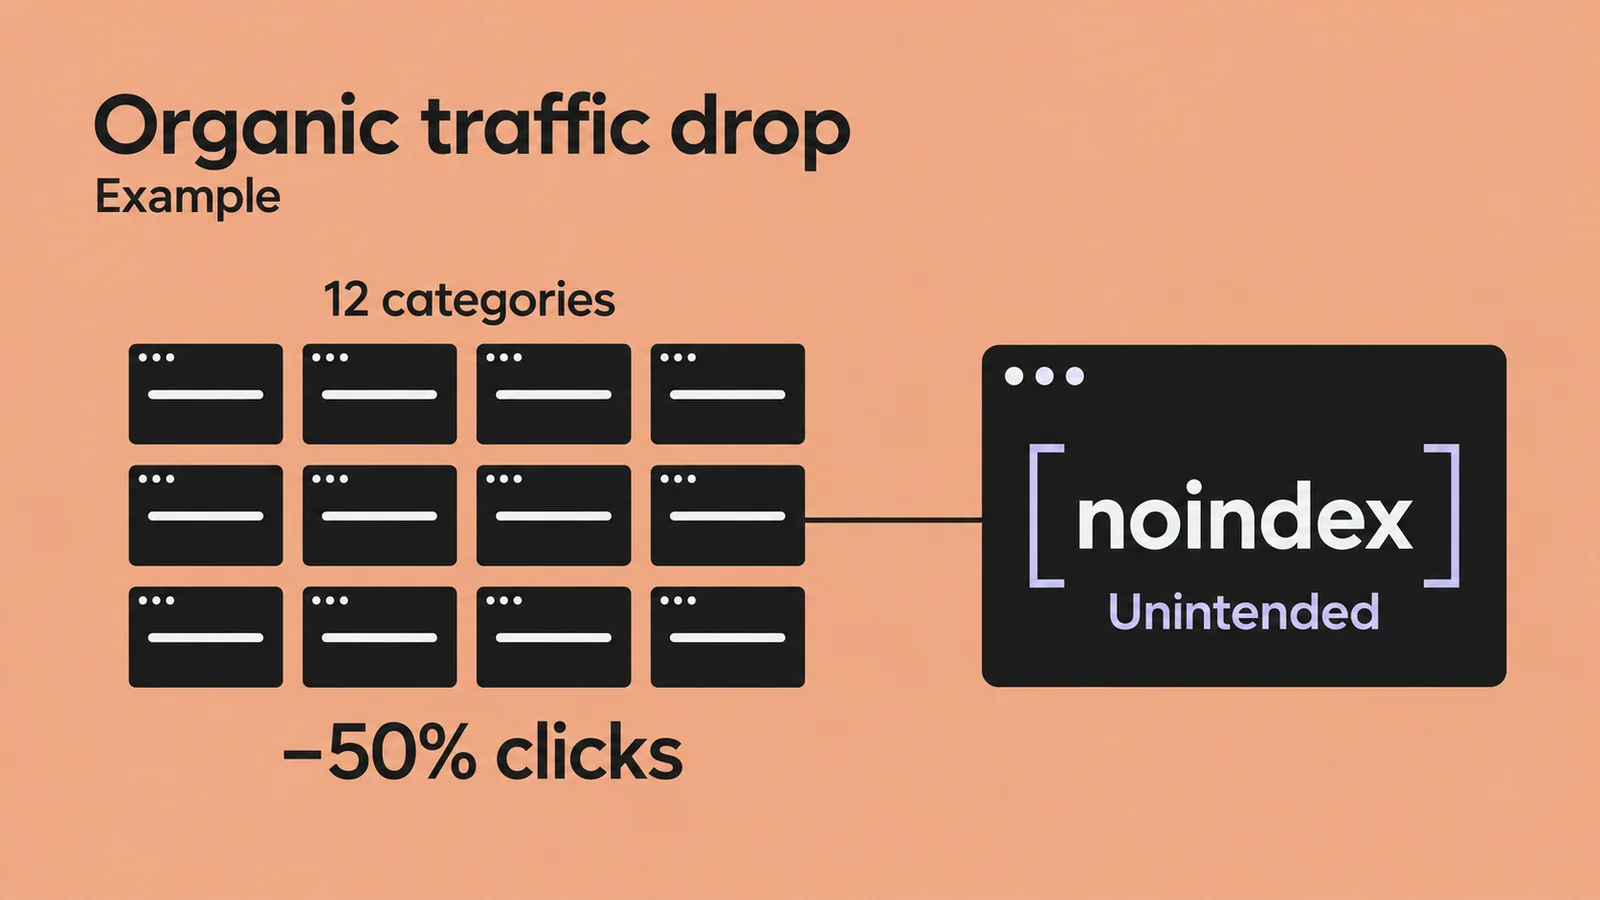
If Search Console stays steady while GA4 changes abruptly, submit a test inquiry, confirm it reaches the right destination and check the event with whoever manages tracking. Also check time zones and which URLs are included. Google's documentation on data discrepancies helps distinguish collection problems from differences between systems. If search traffic is down as well, follow the organic traffic drop diagnostic guide.
Is growth coming from your brand or from other searches?
Consider two fictional searches: "Lakeside Machine Service contact" names a business; "industrial lathe maintenance" names a service. The first searcher may have heard of the business elsewhere. The second may be looking for help without naming a provider. Either search can lead to a customer, but growth in each calls for a different explanation. Existing customers can use nonbranded queries, too, so those searches are not automatically evidence of new customer demand.
Open the Queries tab in Search Console's Performance report. If the branded/nonbranded filter is available, review how it classified your queries: it can make mistakes and is not available for every property. Otherwise, choose "Add filter," "Queries" and "Custom (regex)," then enter your brand name and common variations. For the fictional business, start with lakeside machine service|lakesidemachineservice. If you add "Lakeside" on its own, check that you are not including unrelated searches for a place. Use "Matches regex" for branded queries and "Doesn't match regex" for the other group.
Save the expression and use the same rules for both periods. Record branded clicks, nonbranded clicks and the unfiltered total. Search Console's query data limitations explain why the groups may not add up to that total: some queries are anonymized, and other rows are unavailable. Leave the difference unclassified instead of assigning it all to nonbranded searches. Google's advanced filtering instructions explain how to use regular expressions.
Compare CTR and position for the same set of searches
CTR is clicks ÷ impressions × 100. Search Console's average position summarizes your site's topmost position across the searches being measured. It can change when the mix of queries changes. Before editing a title or page, compare that page for relevant searches in the same country and on the same device type. A worse overall average alongside many new queries does not prove that your previous rankings have fallen.
Which pages bring visits that turn into inquiries?
In GA4, open the Landing page report. Add "Session source / medium" as a secondary dimension and filter for google / organic. Export the landing page, sessions and the specific key event that records an inquiry or purchase. If the report is missing from the menu, an editor can add it through the report library.
Group URLs by purpose: services, categories, products and guides. Keep the homepage separate, since branded searches often lead there. More sessions on informational guides can lower the overall inquiry rate even when service pages perform as well as before. You need to know which group changed before deciding what to edit.
A landing page is the first page of a session, even if the visitor submits a form on a later page. When comparing this export with Search Console, check the domain, path and parameters. Search Console generally assigns data to the canonical URL; Analytics can record variations of the URL people actually visited. Do not merge different pages just because they have the same title.
Choose the right event and denominator
GA4 key events are actions you have marked as important. If a column combines downloads, phone clicks and form submissions, select the relevant event before calling that number "inquiries." A phone link click does not confirm that a call took place. For a form, check that the event records a successful submission and does not fire again when the page reloads.
Session inquiry rate = sessions with at least one successful submission ÷ sessions in the segment × 100.
This applies GA4's session key event rate to the event you selected. An event count can include multiple submissions during one visit, so dividing events by sessions will not necessarily give the same rate. For a closer look at forms and the conversion path, see how to measure landing page performance.
How to distinguish an inquiry from a qualified lead
Agree on a written definition with your sales team. An industrial maintenance company, for example, might qualify an inquiry when it concerns equipment the company can service, in an area it covers, with a contact it can reach. Adapt that illustrative rule to your own offer. Job applications, spam and requests for services you do not provide should have separate outcomes.
For each inquiry, keep an ID, date, requested service, source and landing page where available. Add subsequent outcomes to that record: qualified, sales opportunity, customer or reason for disqualification. Remove duplicate submissions before counting leads. If you cannot connect a lead to a channel, mark its source as unknown. Do not allocate unknown leads to channels in proportion to traffic.
Calculate the qualified share using the same set of inquiries: qualified leads ÷ unique inquiries × 100. For the close rate, follow a group of leads received during the same period through to their sales outcomes. Nine sales closed in June may have started as inquiries in January. Dividing them by June's leads would mix two different groups.
For ecommerce, start with identifiable orders, remove cancellations and returns under the rules used in your financial report, and separate new customers from repeat purchases. Reconcile purchase event values with your order system before treating them as actual revenue. For decisions about categories, products and filters, see the ecommerce SEO guide.
Report example: more clicks, fewer qualified leads
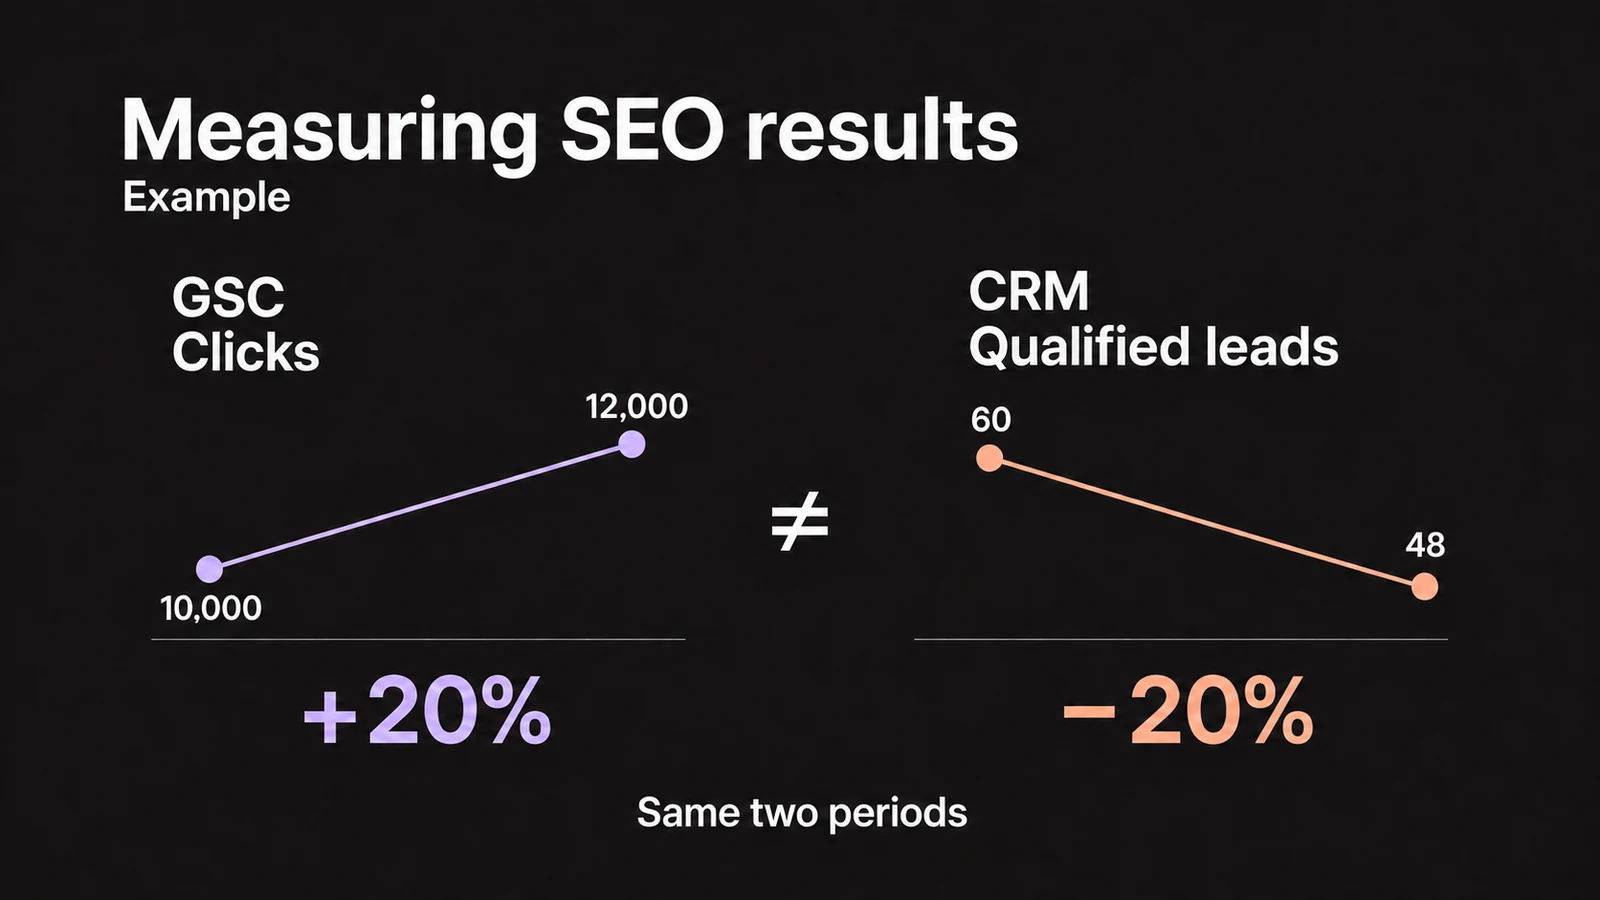
Every number in this example is simulated; none describes a Qreativa client. We are comparing two complete 28-day periods, A and B, with the same filters and unchanged tracking. Search Console covers US web searches; GA4 covers google / organic sessions from the same market. In this example, each session with a submission produces one unique inquiry reconciled in the CRM, and the sales team has assessed every inquiry.
| Metric and source | A | B | Change |
|---|---|---|---|
| Total clicks, GSC | 10,000 | 12,000 | +20% |
| Branded clicks, GSC | 3,000 | 4,800 | +60% |
| Nonbranded clicks, GSC | 6,000 | 6,200 | +3.3% |
| Unclassified clicks | 1,000 | 1,000 | 0% |
| Sessions, GA4 | 8,000 | 9,600 | +20% |
| Sessions with a submission, GA4 | 120 | 120 | 0% |
| Unique inquiries, CRM | 120 | 120 | 0% |
| Qualified leads, CRM | 60 | 48 | −20% |
Click growth is (12,000 − 10,000) ÷ 10,000 × 100 = 20%. Of the 2,000 additional clicks, 1,800 are branded: 90% of the observed increase. Growth is concentrated in searches for the brand. To find out whether demand also increased, compare impressions, CTR and position for those queries, and note any campaigns or events during the period.
The session inquiry rate falls from 120 ÷ 8,000 = 1.50% to 120 ÷ 9,600 = 1.25%, a drop of 0.25 percentage points. The qualified share falls from 60 ÷ 120 = 50% to 48 ÷ 120 = 40%, a drop of 10 percentage points. These raise two different questions: why did a smaller share of visits produce inquiries, and why did a smaller share of inquiries meet the qualification criteria?
The page breakdown shows where to investigate
Period B's inquiries break down as follows. In this example, the CRM records the landing page associated with each submission. If your system does not capture it, your breakdown will be incomplete.
| Landing page | Sessions | Inquiries | Qualified leads |
|---|---|---|---|
| Homepage | 4,000 | 50 | 25 |
| Maintenance service | 2,000 | 50 | 10 |
| Informational guides | 3,600 | 20 | 13 |
| Total | 9,600 | 120 | 48 |
The service page generates 50 inquiries from 2,000 sessions, but only 10 qualify: 20%. Before trying to bring more visitors to that page, read the disqualification reasons. If 30 of the 40 rejected inquiries concerned household repairs the business does not offer, you would have a concrete reason to clarify which equipment it services and review the page's search queries. If inquiries were rejected because contact details were missing or invalid, you would need to check the form fields.
To find out where the 12 qualified leads were lost compared with A, repeat this breakdown for period A. The total alone cannot show how much of the decline came from the service page.
How to calculate return using contribution margin
Add a financial view with an explicit reporting period. Start with net revenue after discounts and returns. Exclude sales taxes imposed on the buyer that you collect and remit, and agree on the treatment of taxes and costs with your accountant. Subtract the variable costs needed to fulfill those sales. The result is contribution margin before SEO spending and fixed costs. Deduct each cost only once.
Return on attributed contribution margin = (contribution margin attributed to organic search − SEO costs) ÷ SEO costs × 100.
A separate six-month financial report for this fictional business has a scope that differs from the A/B comparison: it includes sales recognized during those six months and attributed to organic search, along with SEO costs incurred over the same period. A sale is assigned to organic search when the first inquiry recorded in the CRM came from a google / organic session. Each sale counts once. All dollar amounts are hypothetical, not market prices or Qreativa fees.
| Item | Calculation | Amount |
|---|---|---|
| Sales attributed to organic search | 30 sales × $5,000 net | $150,000 |
| Variable costs of sales | Production and fulfillment | $90,000 |
| Contribution margin before SEO | $150,000 − $90,000 | $60,000 |
| SEO costs for the six months | $20,000 consulting + $12,000 content and development + $8,000 internal labor and tools | $40,000 |
| Margin remaining after SEO | $60,000 − $40,000 | $20,000 |
The return is $20,000 ÷ $40,000 × 100 = 50%. For every dollar spent on SEO, the sales included in this calculation leave $0.50 of margin after that expense. The revenue-to-cost ratio would instead be $150,000 ÷ $40,000 = 3.75. That ratio leaves out the $90,000 needed to fulfill the sales. Neither calculation represents the company's net profit.
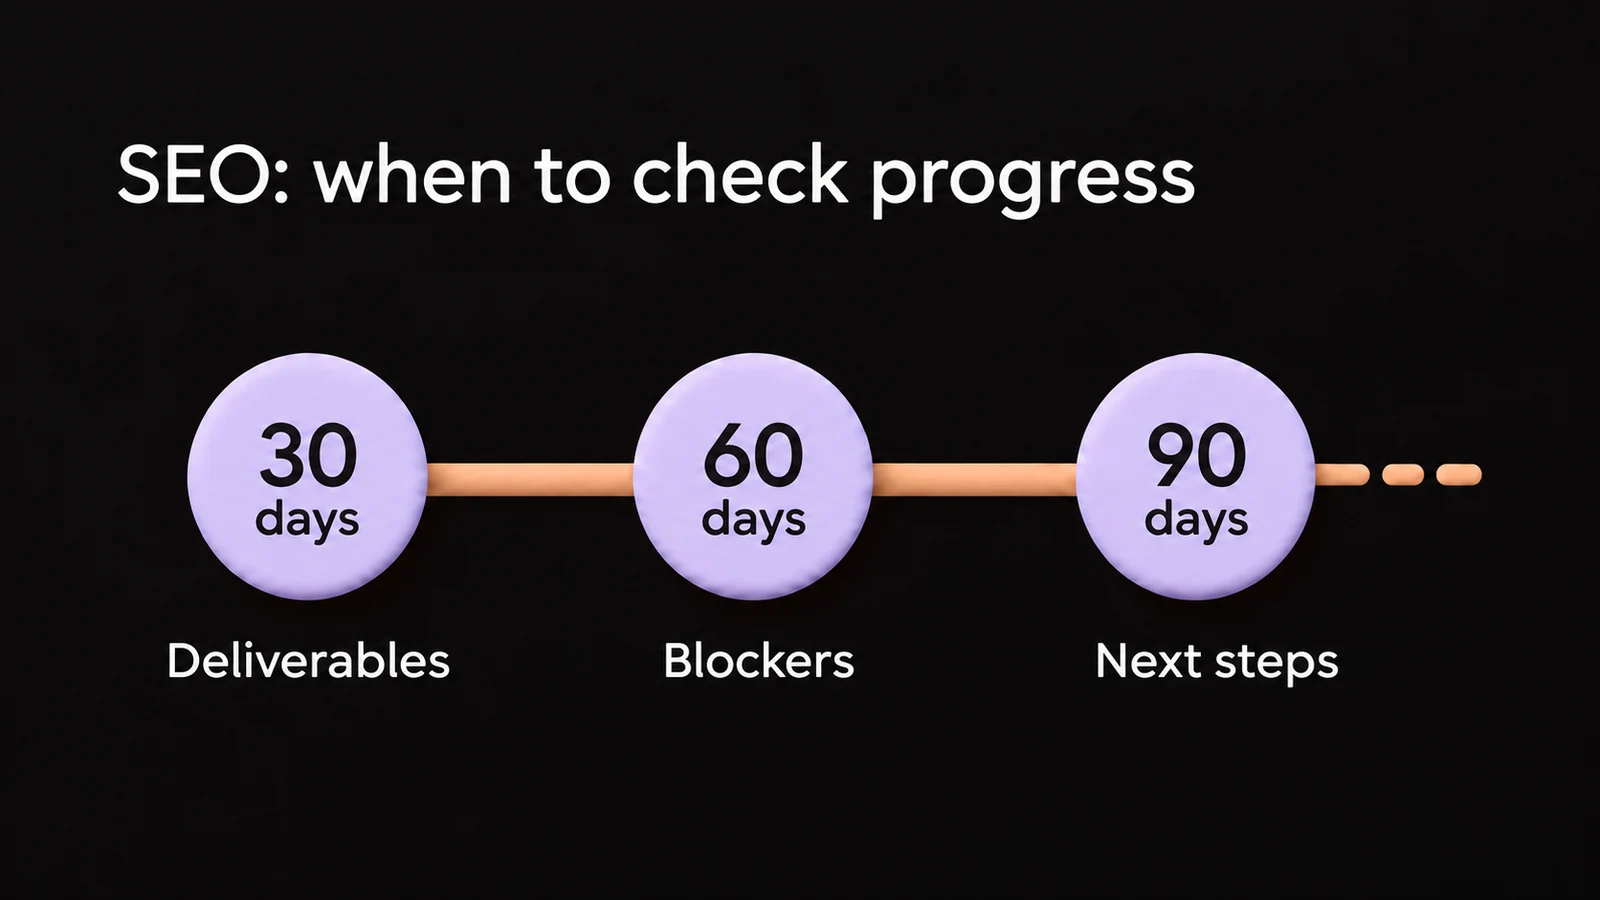
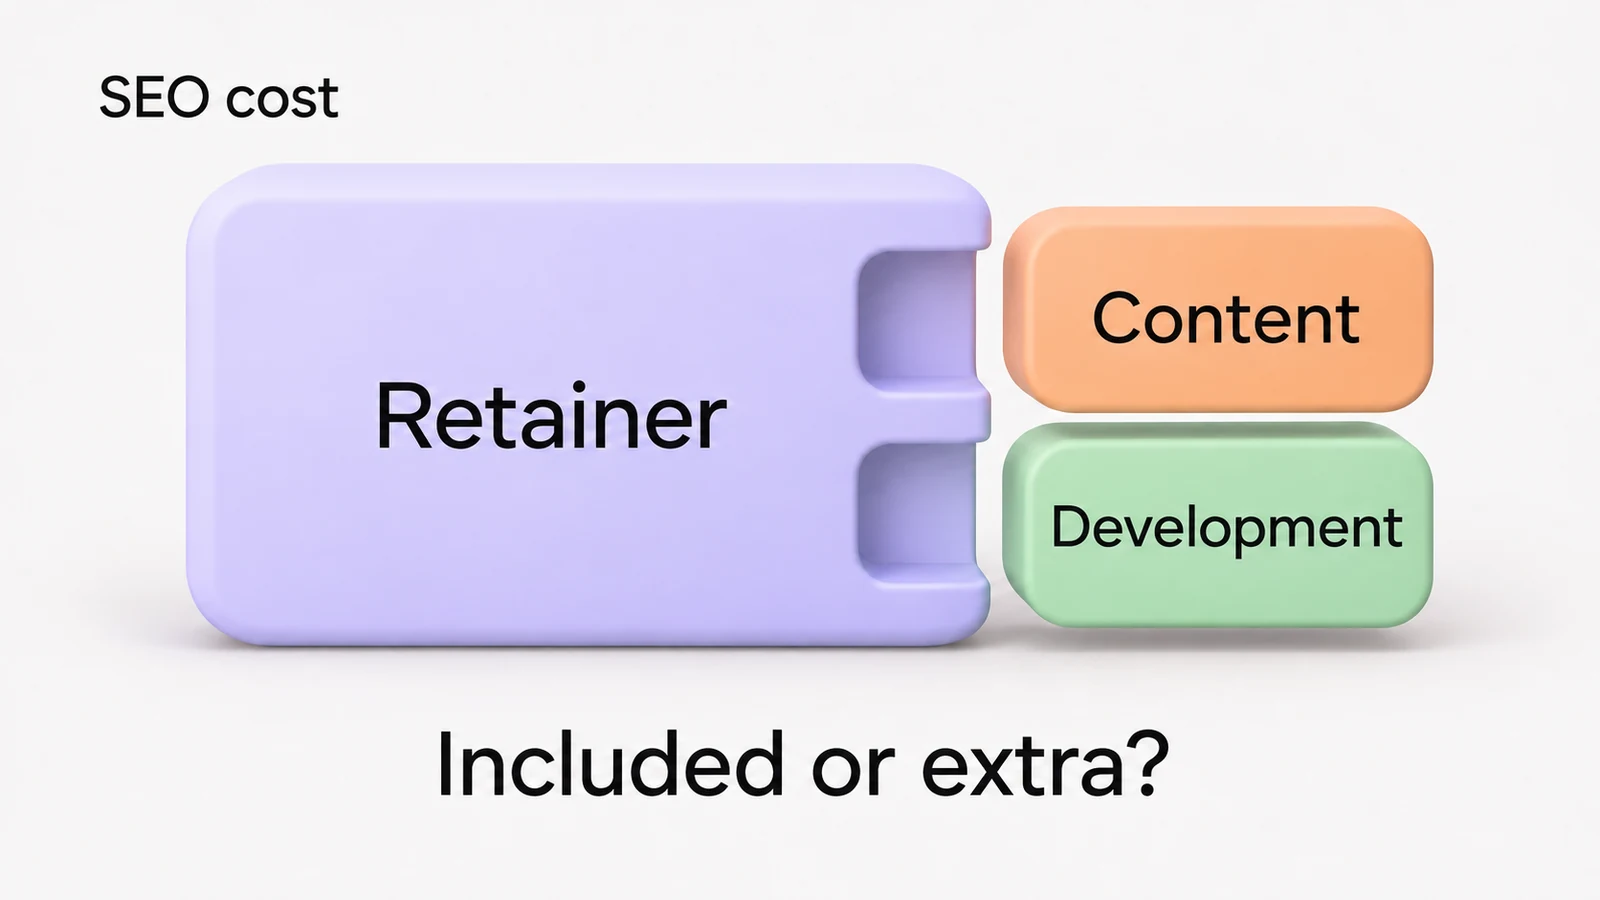
This view measures the channel's financial performance over six months, including contributions from content published earlier. To evaluate a specific project, track its costs and results over a suitable time frame. Comparing last month's invoice with sales that took a year of work will not tell you that project's return. See the SEO cost guide for what a proposal includes and how to compare quotes, and how long SEO takes for the distinction between search progress and sales results.
What can you attribute to SEO, and what remains uncertain?
A customer may discover your business through an article, return through an ad and request a quote after searching for your brand. Attribution determines which interactions receive credit. State the rule in your report: the source of the session that produced the inquiry, the first known contact in the CRM or GA4's attribution model, for example. Keep these different views separate.
GA4's traffic-source dimensions distinguish first-user, session and event scope. Use a session dimension to analyze visits. To understand credit assigned to key events, check the report's attribution model. A conversion with credit split across channels can appear as a decimal; it does not represent a fraction of a customer in your CRM.
Attribution settings include the model and lookback window. Changing the reporting model can also recalculate historical reports that use event-scoped dimensions. It does not change session or first-user dimensions. Save the setting with each export so you know whether the reports you compare were calculated under the same rules.
The example's 50% is a return on attributed contribution margin. Calling it incremental ROI would require estimating how many of those sales would not have happened without the SEO work. You might use a comparison designed around similar groups of pages, accounting for seasonality and other marketing activity. A simple before-and-after comparison does not isolate that effect. If you lack sales source data or contribution margin, mark ROI as unavailable and report the last outcome you can verify, such as qualified leads or confirmed orders.
Turn the report into next steps
End the review with an action for each documented problem, a person responsible and a review date. In the example, first investigate the service page's lead quality. Then decide whether to clarify the offer, fix tracking or work on the searches that bring people to the page. Total traffic growth alone cannot tell you which activity deserves the budget.
| Field | What to record |
|---|---|
| Evidence | Service page: 10 qualified leads from 50 inquiries in period B. |
| Missing information | Disqualification reasons for the other 40, and the same breakdown for A. |
| Owner and first checkpoint | Sales manager: complete the outcomes before the next SEO meeting. |
| Decision based on findings | If household repair requests account for most rejected inquiries, the content and SEO leads review the page's offer and queries. A developer publishes the approved change. |
| Follow-up | After 28 complete days from publication, compare total inquiries, qualified leads and disqualification reasons using the same criteria. Extend the observation period if the sample is too small. |
Keep links to the exports, filters, published changes and next review date in the same spreadsheet. At the next review, you can check whether the work happened and whether the observed problem changed. If you are evaluating a new provider, use these records to compare how SEO agencies explain results and priorities.
When sales data is limited
How should I read a report when we get very few leads?
Always show the counts. Going from one inquiry to two is a 100% increase, but it is still just one additional inquiry. You can combine several comparable months, keep the same qualification criteria and allow each group of leads the same time to close. Meanwhile, review individual inquiries with your sales team. A small sample can reveal a broken form or a recurring need, but it cannot establish a stable conversion rate.
Do I need a CRM to track customers acquired through SEO?
If you handle only a few inquiries, start with a spreadsheet with restricted access. Record the inquiry ID, date, known source, requested service, qualification outcome, deal status and completed sale. Assign someone to keep it updated and agree on how to remove duplicates. Record missing sources as unknown. A CRM makes this easier as the number of leads and people involved grows, but it cannot recover a source you never captured.