 Michele Eccher
On this page
Does the drop hold up to a fair comparison?
Open the correct Search Console property and its Performance report for search results. Save an export before changing filters. You will also need Analytics, if it is installed, and the dates of changes to the site, product catalog, and tracking. Ask the person managing the site for a list of releases around the start of the decline.
Find when the change began
Look at the daily trend. A sudden break and a decline spread over several weeks call for different checks. Record the first clear date instead of relying only on a monthly total. If the site will not load or customers cannot place orders, involve someone who can restore it immediately. Also check Google's reported data anomalies to distinguish a site incident from a reporting problem.
Use complete date ranges
Open the Date filter, select Compare, and set both ranges. As a starting point, compare 28 complete days with the previous 28: each includes every day of the week four times. Adjust that window to your traffic volume and the date of the problem. For a fault that started yesterday, inspect individual days too; a four-week total can hide it. Exclude data still marked as preliminary in the Search Console report.
Keep the scope consistent
Use the same search type, country, device, and page or query filters. Check whether the earlier period included a promotion or holiday. If you have enough historical data, also compare the corresponding period a year earlier and note any calendar differences.
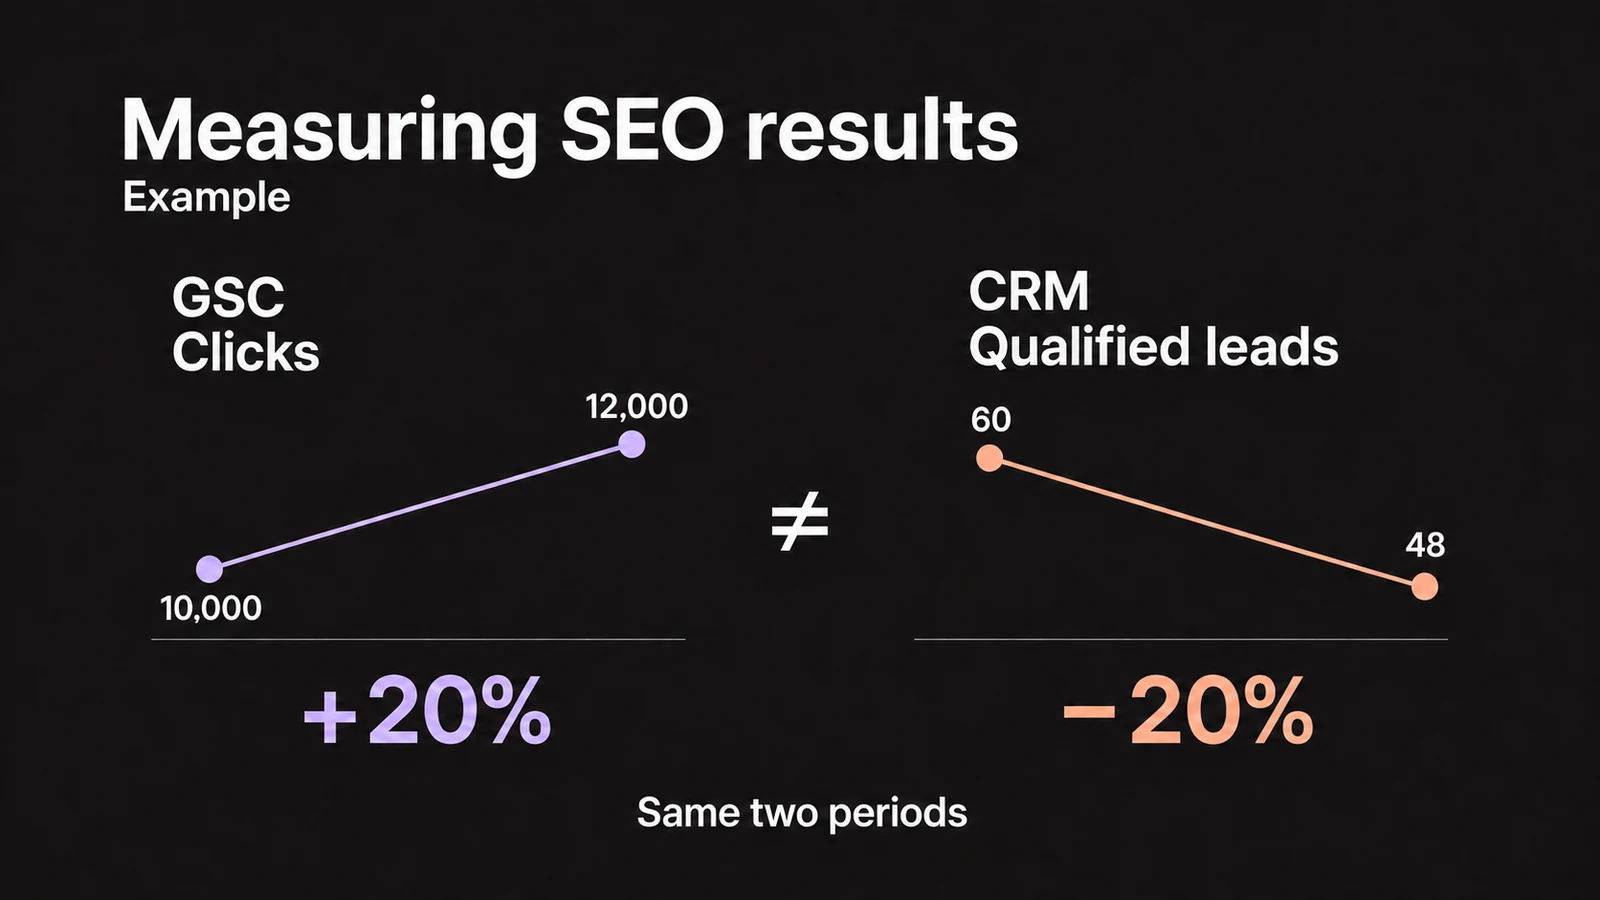
Record both the actual counts and the percentage change. Going from 20 clicks to 10 and from 20,000 to 10,000 both mean a 50% decline, with different consequences. Calculate the change as (later value − earlier value) / earlier value × 100. If the earlier value is zero, report the difference in counts.
Are Google clicks down, or just Analytics sessions?
Search Console measures activity in Google's search results; Analytics records activity on your site. To make the comparison closer, open the GA4 Traffic acquisition report, use the Session source / medium dimension, and select google / organic. The Organic Search channel includes other search engines, so its total is not a like-for-like comparison with Google clicks alone.
Clicks and sessions will not necessarily match. Focus on their trends and the date they diverge. Tag installation, consent settings, and time zones can all cause differences. Google's guide to comparing Search Console and Analytics explains these cases.
Steady clicks, fewer sessions
Open the affected landing pages on mobile and desktop. Confirm that they load, then check tags, the consent banner, filters, and GA4 configuration changes. If a tag is missing only from a new page template, the problem may be limited to that group.
Both clicks and sessions are down
Continue in Search Console to find the pages that lost clicks. Keep the possibility of simultaneous problems open: similar trends in both tools do not prove that every tag is working.
To check data collection, use Tag Assistant on your device and watch events in DebugView. Test one affected page and one that stayed steady, noting the consent choice you made during each test. Missing events when consent is denied do not, by themselves, prove a fault. Ask whoever manages tracking to compare the observed behavior with what the configuration is supposed to do.
Which pages account for the lost clicks?
With the date comparison active in Search Console, open Pages and sort the click difference so the largest losses appear first. Start with the five pages that lost the most clicks and add two that stayed steady, preferably of the same type. Use this small group to find differences worth investigating. If you find a common pattern, check every URL it applies to.
Select a page, then open Queries. Keep the date comparison and add one country or device filter at a time. Look for losses within the same page-and-query combinations. A site total can hide a struggling category while the rest grows. Search Console's filtering and comparison tools let you narrow the analysis without resetting the dates each time.
- If the decline is concentrated in one page template, compare its changes with those made to pages that stayed steady.
- If it affects only one country or device, check the content served, page access, and search results in that context.
- If branded searches have fallen, keep them separate from product or service queries. Check whether a campaign that prompted people to search for the company name has ended.
- If page addresses changed, match old URLs to new ones before treating the old page's traffic as lost.
The visible queries do not account for the entire total. Google omits some searches for privacy and limits the number of table rows. Page-level aggregation can also differ from the chart's totals. Do not force export totals to match; keep track of what each comparison includes. These limits are covered in Google's explanation of Search Console data discrepancies.
What do impressions, CTR, and position tell you?
Impressions count appearances in search results; click-through rate (CTR) is clicks divided by impressions. A numerically higher average position means the result appeared lower on average. Read these metrics for the segment you just isolated. Sitewide averages mix different queries and pages.
| Signal | What to check |
|---|---|
| Impressions and clicks fall; position stays similar | Compare demand and seasonality, but also check for URLs that disappeared. Pages with no remaining impressions no longer contribute to the observed average position. |
| Impressions stay similar; clicks and CTR fall | Examine the same queries by country and device. Check for changes in position, the displayed title, competitors, or search result features. |
| Clicks fall and position worsens for the same queries | Check whether the pages are accessible and indexed. Then compare their content and search intent with the results now ranking above them. |
| A group of URLs loses almost all its impressions | Inspect the URLs, server responses, indexing exclusions, and address changes. First establish whether those pages can still appear on Google. |
For example, 1,000 clicks from 20,000 impressions gives a CTR of 5%; 800 clicks from the same impressions gives 4%. That is a drop of one percentage point in CTR and 20% in clicks. The calculation describes the decline without identifying why fewer people clicked. Google's guide to search traffic drops helps connect these signals to the next checks.
What evidence supports the suspected cause?
Changes to the site or product catalog
Compare the first date of the decline with releases, product removals, category changes, and navigation updates. Open an affected page in URL Inspection and record its indexing status, last crawl, and Google-selected canonical. The live URL test checks the current page; it does not prove that the page is already indexed.
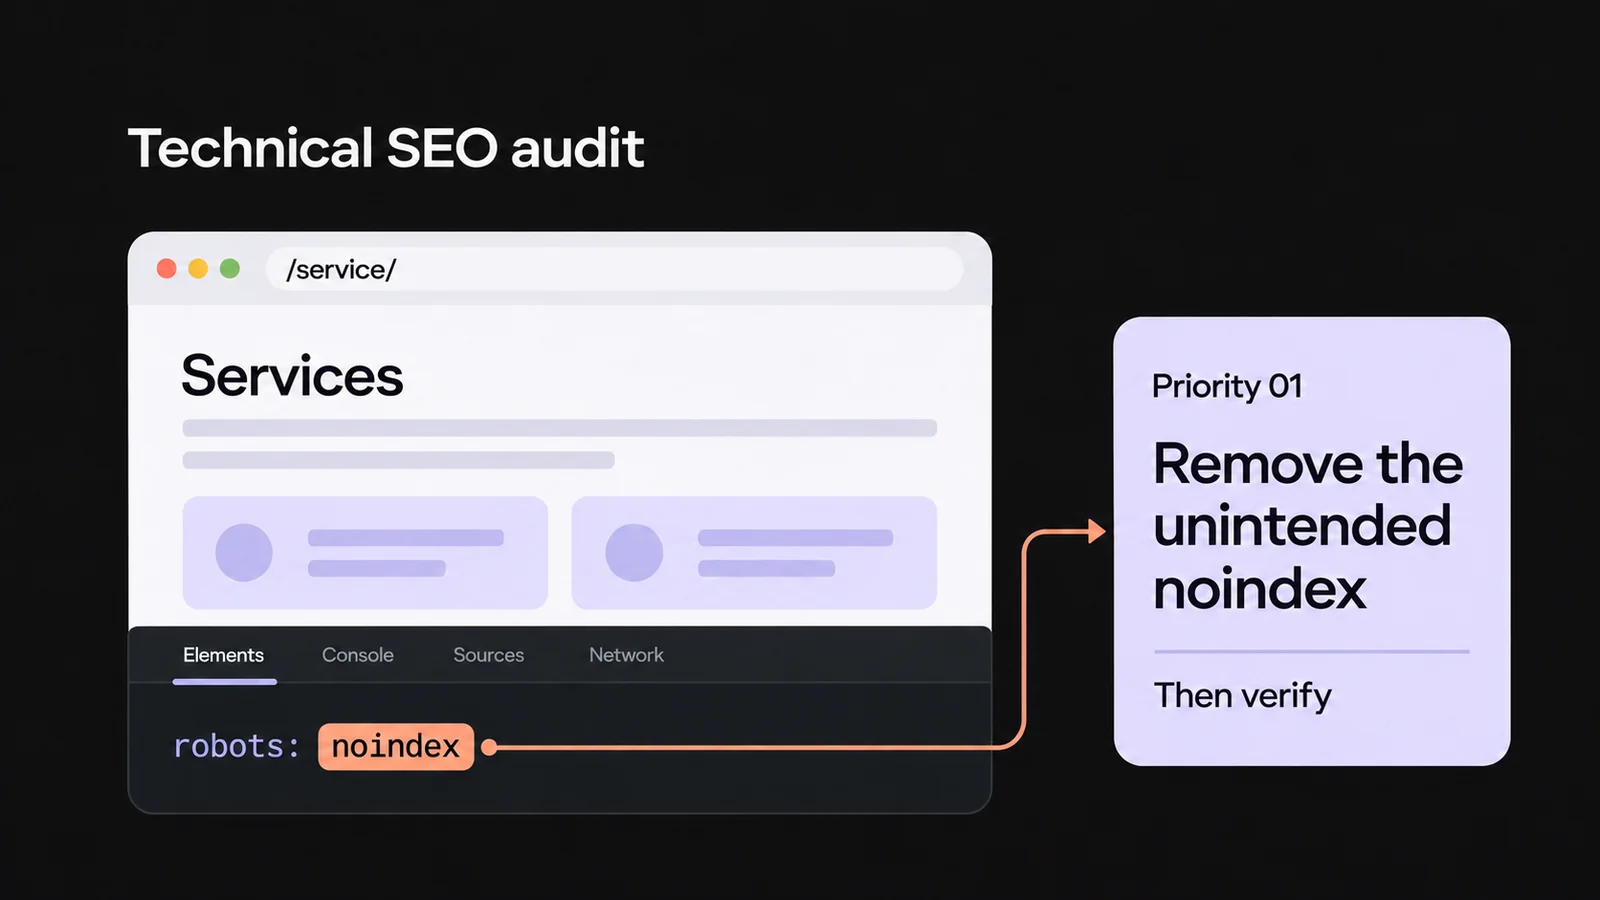
Look for a reproducible difference: a 404 response on a page you still need, a server error, content that fails to load, a redirect to the wrong destination, or an accidentally added noindex directive. A product removed intentionally calls for a catalog decision. Do not restore empty pages simply to return to the previous URL count.
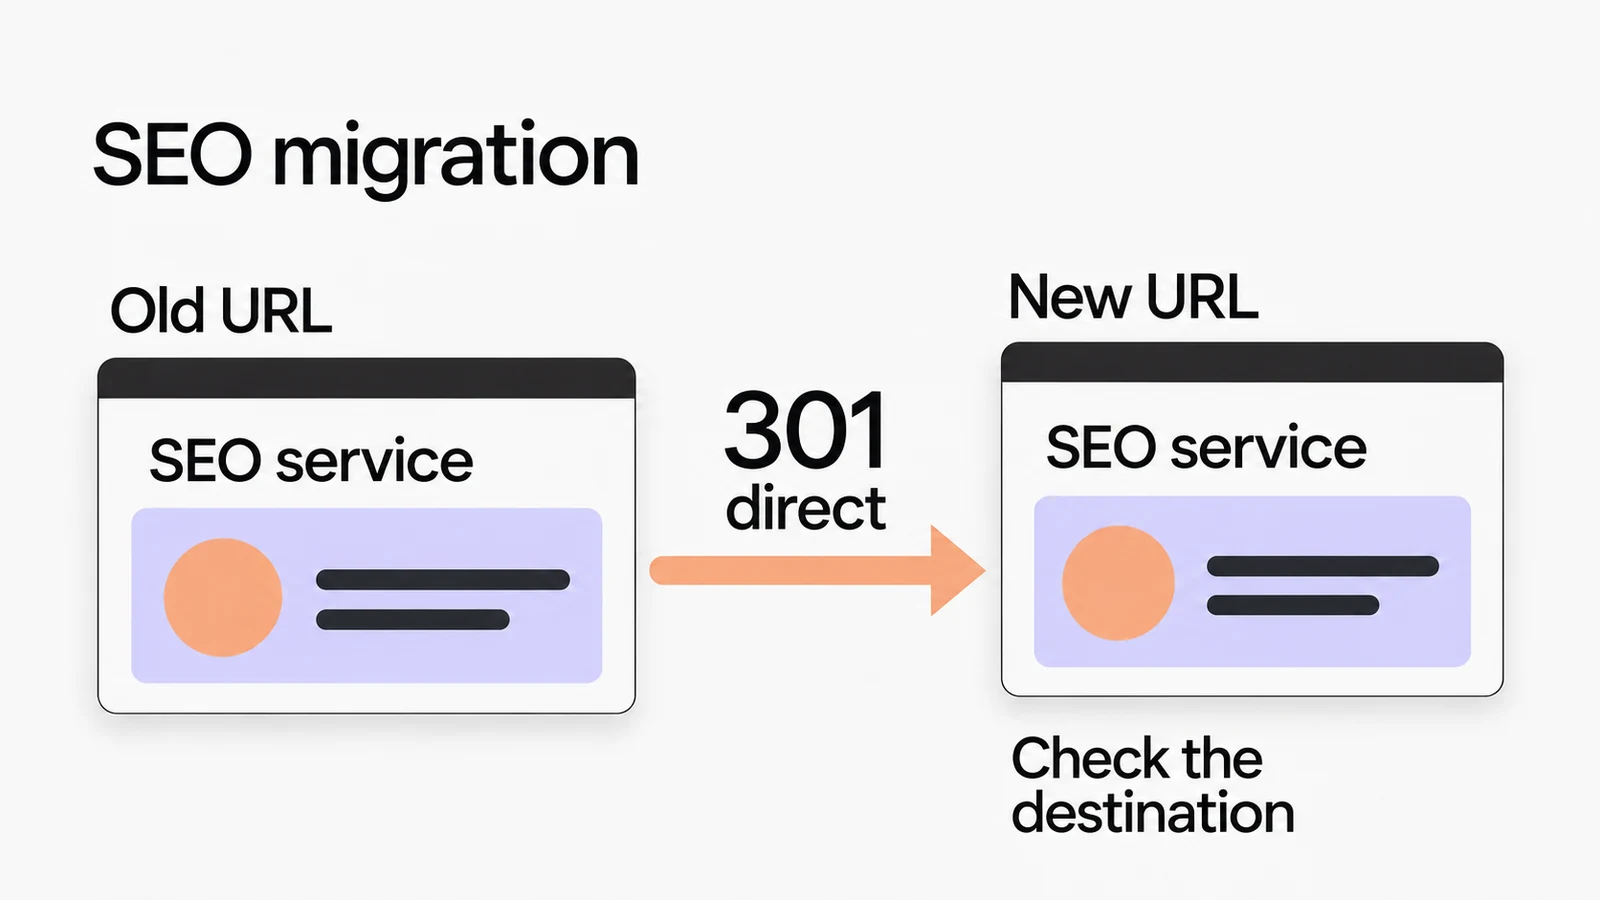
If you find a technical problem, the technical SEO audit guide covers further tests. If the domain or page addresses changed, use the SEO migration checklist. Google recommends monitoring old and new URLs together during a site move.
Lower search demand
Look up the main queries that lost impressions in Google Trends. Select the same country and a date range that allows a year-over-year comparison. If the decline recurs in the same season, also examine product availability and the sales calendar. Trends shows relative interest on a scale of 0 to 100, not absolute search volume. A value that halves does not prove that searches have halved. Account for this data normalization when comparing Trends interest with your site's clicks.
Changes in search results and content
Repeat the affected searches for the relevant country and device. Record the date, page shown, title, competitors' content types, and any ads, maps, or AI answers. A manual search captures one moment. Without an earlier comparison, it cannot show when the results changed.
If your page serves a different need from the current results, note the specific mismatch. A guide explaining a product serves a different purpose from a category page where people can buy it. Before rewriting, use an SEO content audit to decide which page should answer that query and what it is missing.
Google updates or Search Console warnings
Check the Google Search Status Dashboard and your property's Manual actions and Security issues reports. A core update and a manual action are different events. A declining chart alone does not establish that the site has been penalized.
To assess a possible core update effect, Google recommends waiting at least one full week after the rollout finishes, then comparing that week with a week before the rollout began. Apply this advice when analyzing rankings; do not delay fixing faults you have already confirmed. Google's core update guidance advises against drastic changes for small fluctuations and calls for closer investigation of large, persistent declines.
Worked example: the decline affects twelve categories
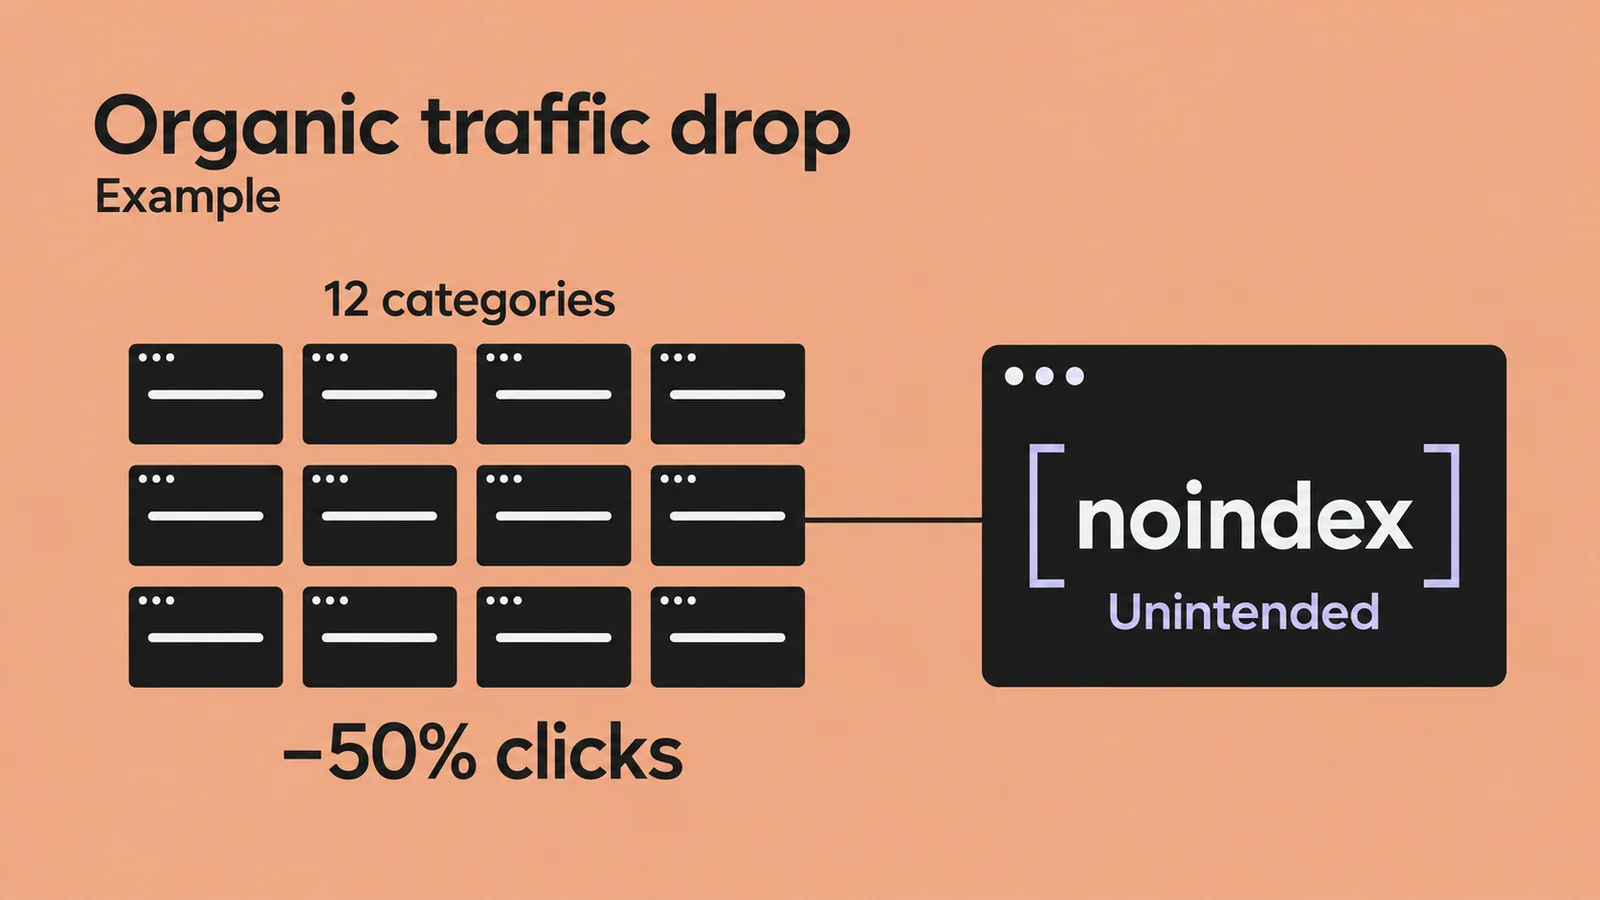
This is a hypothetical example, not Qreativa client data. An ecommerce site sees fewer visits after a category template change. The analyst compares September 3 through 30 with October 1 through 28, keeping Web search and the Italy country filter unchanged. Both periods cover 28 days. The figures come from the same page-level export, split into two groups with no overlap.
| Group | Before | After | Change |
|---|---|---|---|
| 12 categories | 6,000 | 3,000 | −3,000 (−50%) |
| Other pages in the export | 4,000 | 4,000 | 0 (0%) |
| Export total | 10,000 | 7,000 | −3,000 (−30%) |
The twelve categories account for the export's entire net decline. Their impressions fall from 100,000 to 50,000 while CTR stays at 6%. Average position moves from 5.2 to 5.1. That looks like a slight improvement, but it is calculated from the remaining impressions. It does not rule out pages having stopped appearing altogether.
First hypothesis: Analytics stopped collecting data
Search Console also records fewer clicks for the categories, so a GA4 problem alone cannot explain the decline. Tests on the selected pages show the tag sending the expected events. The analyst moves on to indexing checks.
Second hypothesis: the release introduced an indexing exclusion
The first five category pages contain an unintended
noindexdirective. The analyst expands the check and finds it on all twelve. The two pages that stayed steady use a different template and do not contain it. URL Inspection reports exclusion bynoindexon pages already recrawled since the release. Comparing code versions confirms when the directive appeared.Decision: fix the directive in the template
The developer removes the unintended exclusion, verifies every affected category, and checks that pages meant to stay excluded retain their rules. The analyst saves the live test results and will monitor subsequent crawls, indexing, and clicks. The fault is confirmed; any recovery in clicks still needs to be measured.
Rewriting the copy or changing every title immediately would have added work without resolving the exclusion. If clicks remained below the baseline after Google recrawled and reindexed the pages, the analyst would need to revisit demand and rankings for the same group.
How to separate hypotheses, evidence, and decisions
Copy this log into a document or spreadsheet. Use one row or entry for each hypothesis so everyone involved can see what has already been checked. Link exports and screenshots to their dates.
Investigation opened:
First date of the drop and data source:
Baseline period / decline period:
Property, search type, and filters:
URL or page group:
Metric before / after / change:
Hypothesis to test:
Expected evidence if the hypothesis is correct:
Check performed, date, and result:
Hypothesis supported / ruled out / still open:
Outstanding check and person responsible:
Agreed action and person responsible:
Change date and version:
Technical check after the change:
Next data comparison and criteria for interpreting it:
In the example, the hypothesis is "the category template introduced an indexing exclusion." The evidence is "all 12 categories have an unintended noindex directive introduced in the release, and Search Console reports its effects on recrawled pages." "Google penalized us" would remain an unsupported hypothesis. Assign someone to the outstanding check before deciding on a fix.
When and how to check after a change
Immediately after the release, repeat the test that demonstrated the fault. Confirm that the page responds, the content loads, the directive is correct, or the event is collected. Record the change date and version. If the check fails, reopen the issue without waiting for next month's report.
To assess search effects, check when Google recrawls the URLs. Then compare complete data using the same filters and date ranges of equal length. You can start by noting progress weekly and repeating the 28-day comparison once enough data is available. With few clicks, you will need a longer window. These are observation intervals, not promised recovery times.
Keep the group of previously steady pages in the comparison. If their traffic falls alongside the pages you fixed, a broader change may need investigation. If the fault is resolved but search performance does not improve, add that evidence to the log and test the next hypothesis. To make these comparisons part of routine reporting, use the guide to measuring SEO results.
More questions about traffic data
What if inquiries drop but clicks stay steady?
Check which pages receive those clicks. A steady total can hide a decline on sales pages and an increase on guides. Then test the contact form or checkout process and compare the inquiries actually received with the events recorded. A missing event and a form that fails to deliver messages need different fixes. If the process works, examine how relevant the visits are and whether prices, availability, or the offer have changed.
How can I investigate without Search Console access?
Ask the owner for read-only access or exports that show the dates and filters: daily trends, page comparisons, top queries, countries, and devices. For suspect URLs, also ask for the URL Inspection results. Meanwhile, you can check whether the site is available and inspect public content and redirects. A third-party tool's traffic estimate can suggest where to investigate, but it cannot replace the clicks observed in Search Console or the sessions recorded on your site.